4.4 Manual thread count
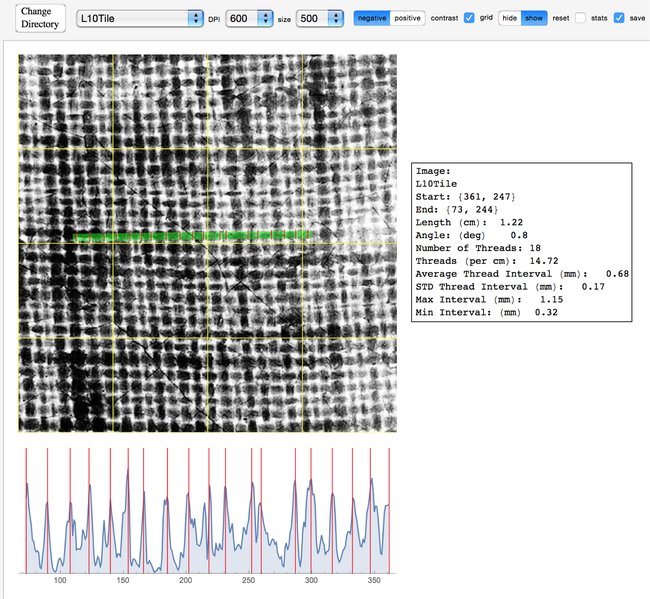
The second of the major functions in the main screen (§ 4.2, figure 1) of the countingVermeer software is the ‘Manual Thread Count’ function called threadMarker. This reads any collection of patches in the .tif format, such as are saved by the ‘Look at X-rays’ function. Select the new directory using the ‘change directory’ button. By default, an assortment of patches from the Vermeer X-rays are available in the menu, and figure [1] shows one of these. If enabled, the yellow grid shows 0.5 square cm blocks, and the X-ray can be displayed in positive or negative mode, with or without contrast enhancement.
To use this interface to count threads, move the green line around by dragging its two endpoints. Place these in convenient locations (both centered on either white or black regions). Then, you can command-click (on a Mac, or Control-click on a PC) to add new red markers. Place the markers at each place the thread crosses the green line. Observe the graph at the bottom: this shows the contour of brightness along the green line: high points are white and low points are black. The peaks or valleys can often be used to fine-tune the position of the markers.
In the screenshot shown in figure 1, the ‘stats’ button collates the information about the marked threads. In this case, 18 threads have been counted along a 1.22 cm segment, so the thread count is 14.72 threads per cm. When pressing the ‘save’ button, information is also recorded about the exact position of the green line, the average (marked) thread interval, and the maximum and minimum intervals.
1
The threadMarker function allows for an informed and easy-to-document manual thread count. Locate the threads crossing the green line, mark the red locations indicating thread boundaries, and the computer will handle the math and the documentation.