4.6 Strategies for manual counting
When conducting manual thread counts, several decisions must be made about how to choose locations, where to count, how many counts to take, how wide an area to count, etcetera. This section looks at these questions from a statistical point of view, which allows for deriving rules of thumb to help relate how these decisions may affect the overall accuracy of the counting process.
Begin by conducting two ‘thought experiments’ to see what the issues are. First, imagine a perfect canvas. In this perfect canvas, the weave and threads are absolutely uniform, every thread is the same size, the spacing between every pair of threads is identical, and the mounting of the canvas on the frame introduces no distortions. Clearly, it will not take very many measurements to accurately determine the average value of the thread count. Moreover, because the weave is uniform, the average will be the same no matter where the measurements are taken. Alternatively, imagine that the weave is completely and utterly irregular: no two threads are the same size, no two spaces are the same, and the stretching on the canvas introduces extreme distortions. To be absolutely sure of finding the true average, it would be necessary to count every patch, and perhaps even at multiple locations within each patch.
In reality, a physical canvas is neither perfectly uniform nor utterly random. This may be ‘modeled’ by imagining that the thread count has an average value and that there is some variation about that average among the different patches. This kind of situation is not uncommon, and over the years statisticians have developed rules of thumb that can help simplify and quantify how many samples must be measured given the desired accuracy and the expected variation in the samples.1
This same argument can be applied to estimate how accurately a collection of manual thread counts will represent the actual average thread count. Consider a canvas such as The Milkmaid (L07), which is approximately 45.5 x 41 square cm. Taking a thread measurement in each 1 square cm block would require a total of 1865 measurements. The average thread measurements are on the order of 15 threads/cm, and (as discussed in chapter 6) it is desirable to find the true value within +/-1 thread/cm. This variation is approximately 7%. Choosing a confidence level of 90% and following the same kind of logic as in the polling example (note 5) yields a sample size of 128. This means if 128 thread locations were measured many times, then 9 times out of 10, the average will lie within 7% of the true average (that is, if all 1865 locations were measured). Alternatively, it is possible to estimate the error incurred if a specified number of samples are measured. Consider sampling 15 locations, a total number of patches equal to 1865, and a confidence level of 90%. In this case, the formula (1) shows that there is approximately 21% error, that is, nine out of 10 times, the true answer will lie within +/-3.15 threads/cm.
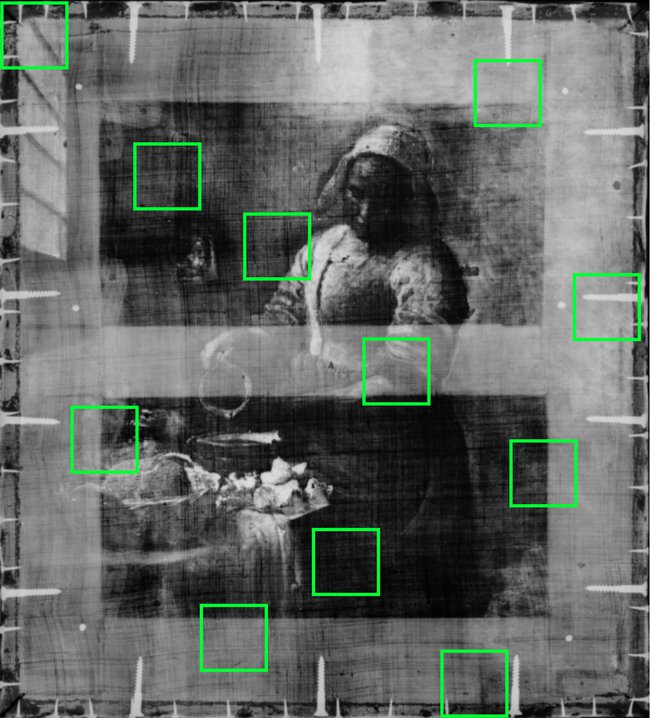
This technique provides good estimates when the individual measurements are independent of each other. In a canvas, the structure of the parallel interwoven threads represents a complex set of dependencies that likely cause the estimates to be overly pessimistic. A unique feature of the thread counting is the spatial distribution of the information. For example, it would be poor strategy to take all the measurements from a single column because the behavior of the threads on all other columns would not be taken into account.2 This suggests examining patches from an equal number of rows and an equal number of columns, along the diagonal, or along any shuffling of the diagonal, where the image looks easy to count. For example, figure [1] shows a minimal set of arbitrary locations that cover all rows and columns.
Achieving an accurate manual estimate of the average thread count requires more than statistics. First, it makes no sense to try to count locations where it is difficult to see the canvas clearly. Second, the spots must be chosen to capture all possible rows and columns, otherwise anomalies may exist in these unmeasured locations. Finally, because manual counts are constrained to a small number of measurements, these must be taken at carefully chosen locations where the thread densities are representative of the average. This is why it is important to use good judgment when carrying out the manual counts and to carefully document the procedure as it is carried out. Using the threadMarker function makes it easier to do the manual counting, and automatically document the results.
1
The specific choice of sampling locations is flexible; what is important is to sample approximately the same number of times from each row and from each column, and to cover all rows and all columns. This figure shows an arbitrary set of sampling locations (the green boxes) spread across the surface of an X-ray of the canvas from Vermeer’s The Milkmaid.
Notes
1
This kind of argument will perhaps be familiar from the realm of polling, where the goal is to estimate the percentage of voters who prefer the Red Party and the percentage who prefer the Blue Party in an upcoming election. When properly presented, such polling is reported not as a single number (the percent that will likely vote blue or red), but with a variance, a level of confidence, as well as the number of participants in the poll. Thus: 750 registered voters were polled, 52% chose blue, with an expected error of +/- 3%. Left unsaid is that this is calculated with a certain level of confidence (say 90%). A fuller interpretation of these numbers is: if the survey of 750 people were conducted many times, then 9 times out of 10 (that is 90%) the survey would return answers between 49% and 55%. In statistics, the sample size (the number of people to poll) can be calculated assuming a bell-curve distribution as:
sample size = N z2/(4 e2 N + z2) (1)
where N is the total population (total number of registered voters), e is the error (+/-3% above), and z is the number of standard deviations away from the mean (typically z=1.645 for 90% confidence and z=1.96 for 95%). Histograms of the thread and angle densities (such as appear in §5.4) suggest that the data is reasonably well approximated by a bell-shaped curve.
2 Implicit in E. van de Wetering, ‘The Canvas Support’, from Chapter 5 of Rembrandt: The Painter at Work, Berkeley/Los Angeles/London 2000, is that a bundle of vertical threads has close to the same count in every patch along the bundle. Hence Van de Wetering warns against counting the same threads twice in order not to degrade the calculated average.