5. Automated Creation of Weave Maps
William A. Sethares
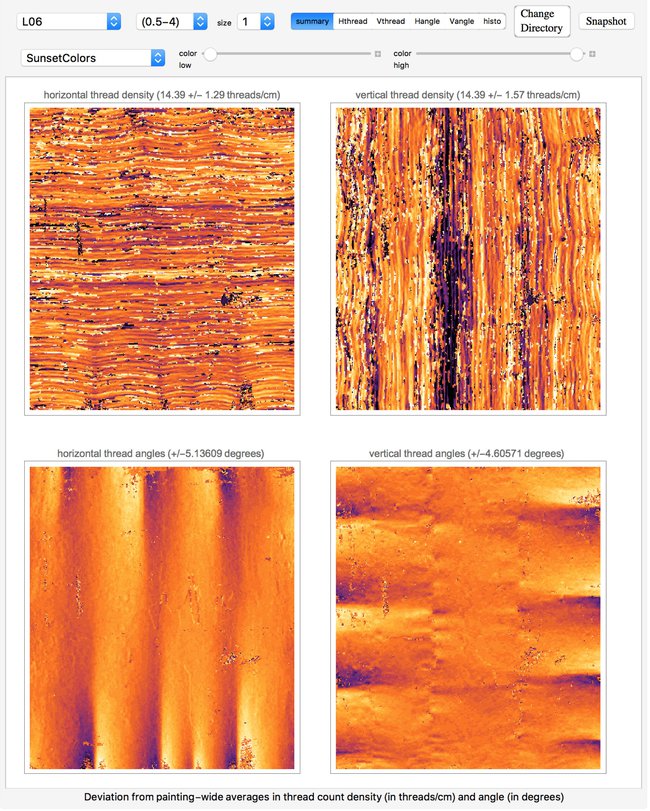
This chapter introduces free software for calculating, displaying, and studying patterns of threads in canvas X-rays. The resulting weave maps may be displayed as either thread maps or angle maps. Thread maps display the variation in thread density across the canvas as shown in the top two images in figure [1], while angle maps show deviations in the angle of the threads (from the true horizontal and vertical orientations) as in the bottom two images of figure [1]. It is reasonable to interpret thread maps as showing how the thread count varies over different portions of a canvas. In this view, darker regions show where the thread density is low (where the threads are relatively far apart) and lighter regions correspond to regions where the thread density is high (where the threads are relatively close together). The visible stripes can be seen as clusters of warp (or weft) threads that are packed more tightly (or more loosely) over the length and breadth of the canvas.
Though this is a reasonable interpretation, it is not precisely how the procedure operates. First, there are no ‘threads’ in an X-ray image. As discussed in chapter 2, what we see in the X-ray is the thickness profile of the radio-absorbent ground layer; we are not seeing the threads, but the ground layer as it covers the threads and fills the spaces between the threads. Secondly, the method does not ‘count’ the way a human might, by looking at the first item, then the second, and keeping a tally. Rather, it calculates a kind of average periodicity over many small area regions of the canvas. If the threads are unevenly spaced or of non-uniform thickness, if the digital images are of poor quality or grainy with noise, the calculations may differ.
Thus there are two goals for this chapter: to show how the ‘thread counting’ software works, and to explain the meaning of weave and angle maps calculated via the Fourier transform such as those in figure [1]. The goal of the chapter is to present enough of the underlying computational science so that the reader can anticipate problems and help himself in assessing to what degree the images can be trusted. Together, these will prepare the reader for the analysis of the Vermeer canvases in chapter 6.
Cover image
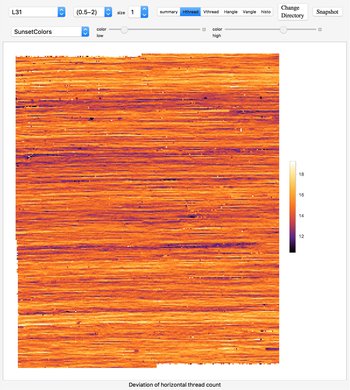
The Hthread, Vthread, Hangle, and Vangle display options present a more detailed version of the selected map.
1
These thread (top two images) and angle maps (bottom two images) of Vermeer’s Officer and Laughing Girl show a canvas with average thread counts of 14 threads/cm in both directions. The software interface allows for changing the colors and size of the regions used to carry out the calculations.